Clinically relevant dissolution specifications: selection and assessment
Posted: 9 January 2019 | Chun-Hang Tang, Juliet Symonds, Kevin Lief | No comments yet
Setting specifications for new oral products can be challenging. Too lenient, and there is a risk of passing batches of inadequate quality; too stringent, and there is a risk of rejecting acceptable batches.


One reason for this is that they are often based on the data from a limited number of batches. The Food and Drug Administration favour setting clinically relevant specifications (CRS).1 This approach is evolving as it is starting to be more widely used and there is an increase in knowledge and regulatory thinking.
CRS are about test methods and acceptance criteria that identify and accept/reject drug product batches that are likely to perform adequately/inadequately in the indicated populations.
Historically, dissolution development and assessment has often been independent of in vivo behaviour. The data used to set specifications was generally based on a limited set of clinical, development and commercial batches. Most of the data generated assessed only the in vitro performance of the product. The clinical relevance of the specification was often unknown, as limited clinical data is generated prior to approval making it difficult to assess whether changes in dissolution have any impact in vivo. The in vitro dissolution methodology can be either over- or under-discriminating to changes in vivo.
There are many benefits to having clinically relevant tests and acceptance criteria. These include being able to:
- Reject batches that are not bioequivalent to pivotal clinical batches
- Indicate product changes that might impact bioavailability
- Ensure that batch-to-batch variability is limited to acceptable levels for commercial product compared to clinical material.
When tests and specifications are not over or under-discriminating, it enables greater understanding of the product and ensures more robust and consistent product performance over time.
For an immediate release product, there is an expectation by the FDA to have a specification of Q=80 percent. This can make developing a biorelevant predictive dissolution method difficult for drugs where dissolution does not approach completion in vivo. Although dissolution methods showing incomplete release can be used during product development, having one method that is both biorelevant and acts as a quality control test is a challenge.
No dissolution method will be a perfect simulation of the in vivo environment, but in many cases, we can still aim to achieve discrimination for the most important variables of the product that impact the pharmacokinetic (PK) parameters, even in the QC test. The best way to do this is to demonstrate a relationship between dissolution and clinical performance based on an understanding of the critical quality attributes (CQAs) of the product. To do this, consider the Biopharmaceutics Classification System (BCS) class of the drug and develop an understanding of what is controlling dissolution and how that relates to in vivo performance. This is best achieved by understanding the dissolution process of your product and the various steps that influence drug release. If disintegration is the rate-limiting step and determines bioavailability, then it may be important to consider how it influences the test method. Alternatively, if dissolution of drug particles is likely the rate-limiting step, then a method should be designed to discriminate with respect to drug particle size.
CRS are difficult to set using the in vitro and in vivo data traditionally available. Biorelevant dissolution coupled with PK data and in silico modelling can be used to highlight relationships and correlations. A combination of early development data – in vitro, in vivo and in silico modelling – can all be used to develop clinically-relevant specifications.
Physiologically-based pharmacokinetic (PBPK) models that enable simulation of PK in humans and animals can be a valuable tool, using information taken from several sources to help product understanding and decision making. These tools can help to understand drug in vivo behaviour and identify product CQAs. For instance, the likely impact of food, formulation change and API particle size on exposure can be identified.
Immediate release products typically have a specification limit at a single time point, which ensures that the active ingredient has fully dissolved at that time. For immediate release drugs, it is typical to have a Q value of 80 percent within 15, 30 or 45 minutes, depending on the dissolution profile obtained.
The most widely used criteria utilised for dissolution is the US Pharmacopoeia (USP) acceptance criteria. There are three levels of testing, which are tested through: stage 1 (six dosage units), stage 2 (12 dosage units) and stage 3 (24 dosage units).
The following sections will outline how to set a CRS for immediate release products before commercial manufacturing using two different concepts: the f2 similarity statistic or tolerance intervals.
The rate of change in dissolution can then be used to assess the sensitivity of the chosen time point. The data obtained from commercial testing can be used to assess the ability to meet the assigned specification.
Setting clinically-relevant specifications
Setting CRS based on clinically-relevant batches
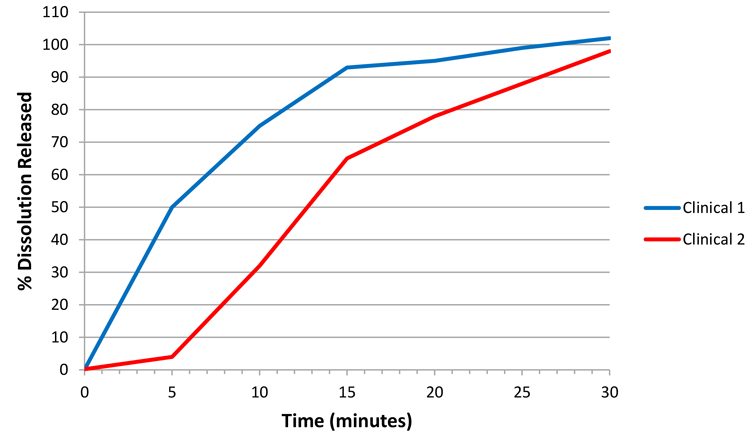
As mentioned in the introduction, an ideal state would be to develop a biorelevant method, hence enabling a CRS. For example, if Figure 1 represents dissolution profiles where ‘clinical 1’ and ‘clinical 2’ represent clinical study batches for which efficacy has been demonstrated, then future batches, whether for an in vivo study or not, manufactured under similar conditions with dissolution profiles falling within the design space captured between the blue and red profiles could be considered to represent an efficacious and safe product.

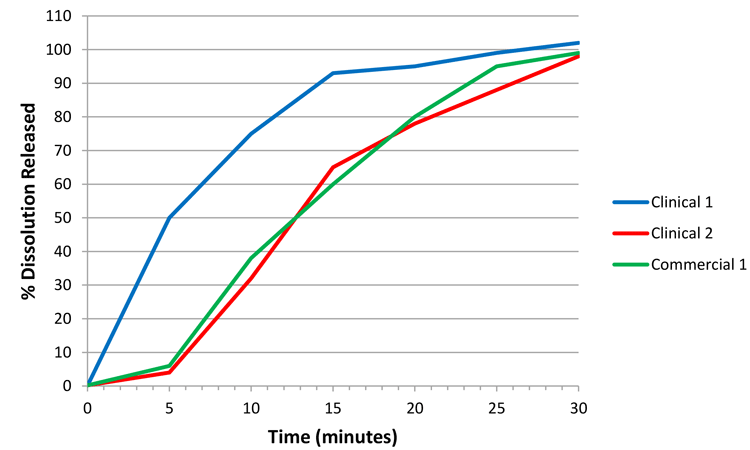
However, consider Figure 2, which illustrates a hypothetical case for a commercial batch, ‘commercial 1’. As the commercial profile is not wholly contained within the design space defined by clinical 1 and 2, a decision must be made as to whether the commercial 1 and clinical 2 batches are comparable. One way of performing the comparison is through the f2 similarity statistic. A property of the f2 statistic is that if clinical 2 is the reference batch, then any dissolution profile contained within 10 percent of this reference will always produce an f2 conclusion of similarity in the profiles (ie, where f2>50).

Therefore, if we solely consider potential profiles 10 percent lower than the clinical 2 batch and 10 percent higher than the clinical 1 batch (applying a similar logic as used on clinical 2/commercial 1), we would produce Figure 3. As the commercial 1 batch is wholly contained within the space defined between the f2 lower and f2 upper bounds, this batch is similar to at least one efficacious and safe clinical batch, and thus we can argue that commercial 1 is an acceptable batch.
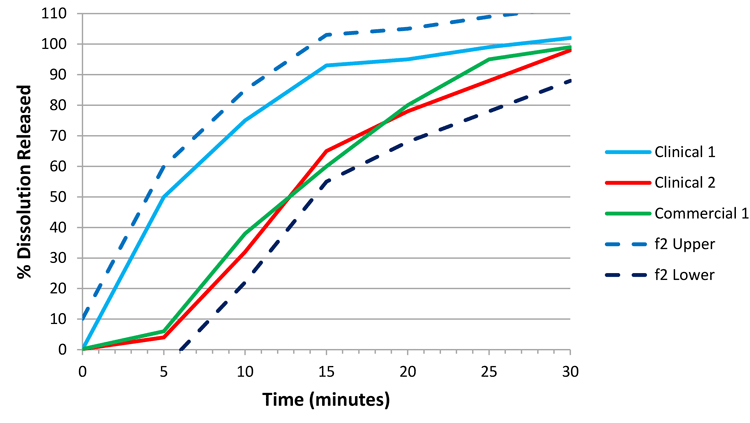

Following through with this argument allows us to then use the f2 lower bound to set the CRS, based on Figure 4. The space defined by the f2 bounds delivers dissolution profiles that are either similar to a clinical batch, or within the dissolution design space identified as safe and efficacious through in vivo experience. Therefore, we have defined a clinically relevant dissolution space. In order to set a specification, we will pick a single time point that summarises the f2 lower bound and employ this value as our specification.
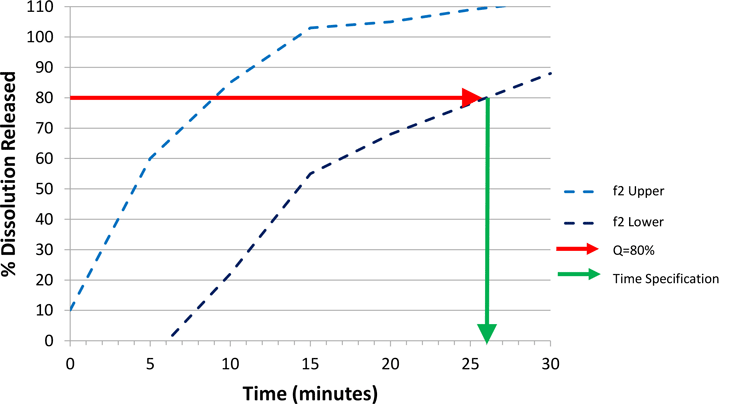

Starting with a Q value of 80 percent (other values can be used), the time at which an 80 percent dissolution release is achieved on the lower f2 bound equates to approximately 26 minutes (Figure 4). For practical reasons, we may round to the nearest five minutes, and therefore set a specification as achieving Q=80 percent at 25 minutes.
We have defined a clinically-relevant dissolution design space. In order to choose a specification, we will pick a single summary time point on the f2 lower bound, which represents a dissolution profile that could be deemed similar to known profiles from batches that have been proven efficacious and safe in vivo.
Setting CRS based on commercially relevant batches
In this process, an allowance has been made for dissolution profiles lying sufficiently close to the clinical batch space. In this case, the whitespace has been based on the f2 comparison test. However, there are other methods that could be used to define such a whitespace; eg, tolerance intervals. A tolerance interval or region identifies from the available commercial data, bounds that cover a stated percentage of the population of dissolution profiles. Hence, this approach is perhaps more aligned to account for the capability of the commercial scale process.
Setting CRS based on the rate of change of dissolution profile
When choosing a dissolution specification time point, it is useful to check the average rate that dissolution is proceeding at that point. If the rate is fast, then sentencing a batch based on this specific time point may lead to inappropriate decisions, as the time point may be too sensitive.
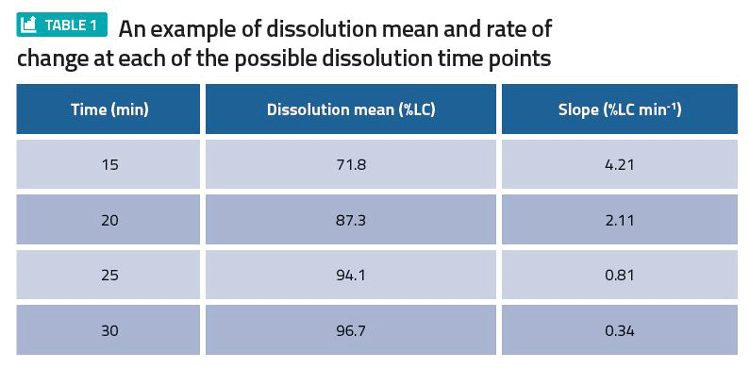
Consider an output of such an analysis for a tablet product in Table 1. Here, 20 minutes with a Q=80 percent of the label claim (LC) had been proposed as a possible dissolution specification time point. However, due to the fast rate of change of 2.1 percent LC min-1, the proposal was altered in favour of 25 minutes at Q=80 percent LC.
To produce an output like Table 1, fit a smooth line (spline) over the mean profile for each batch, calculate the instantaneous slope for each batch, and calculate the average of all the instantaneous slopes.

Assessing relevant specification
Assess the discriminatory ability of chosen Q value and time point using a contingency table
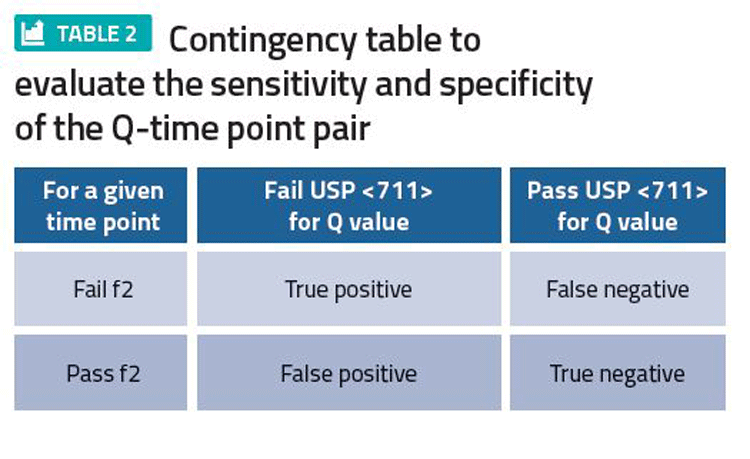
We believe an appropriate specification (Q value and time point) correctly classifies whether a batch is f2 equivalent to a clinical batch. Ideally, the in vivo performance of a batch pending release is checked against the in vivo performance of a clinical batch. Practically, this is not possible, but in vitro criteria such as f2 can be used to compare dissolution performance equivalence between a batch and the clinical batch space. If the Q value-time point pair is chosen well, batches that are not f2 equivalent to the clinical batch space should be routinely rejected by the Q value-time point method. Likewise, batches that are f2 equivalent should be routinely released. If this is not happening, then the producer may need to consider reassessing the Q value-time point pair or consider redeveloping the method to improve discrimination.
Once sufficient commercial data is available, it can then be used to construct a contingency table (Table 2). A false positive represents risk to patients of receiving a batch that should have been rejected, whereas a false negative represents risk to the producer of rejecting a batch that should have been accepted. A discriminating specification is one where there are small false negative and false positive values.
Despite being conceptually appealing, this approach can be difficult to implement. First, there are unlikely to be sufficient batch failures. Second, a dissolution profile (as opposed to one single time point) may not be recorded routinely. Third, even if a dissolution profile is recorded, the profile may not be compliant with the data requirements to perform an f2 comparison. (For instance, no more than one point should be after 85 percent dissolved to be f2 compliant). Finally, since the Q value-time point pair are normally chosen at convenient figures (for instance, 20 minutes, 25 minutes, or 75 percent, 80 percent), the actual number of candidate pairs that can be chosen is limited.

Assess the commercial viability using the Bayesian method
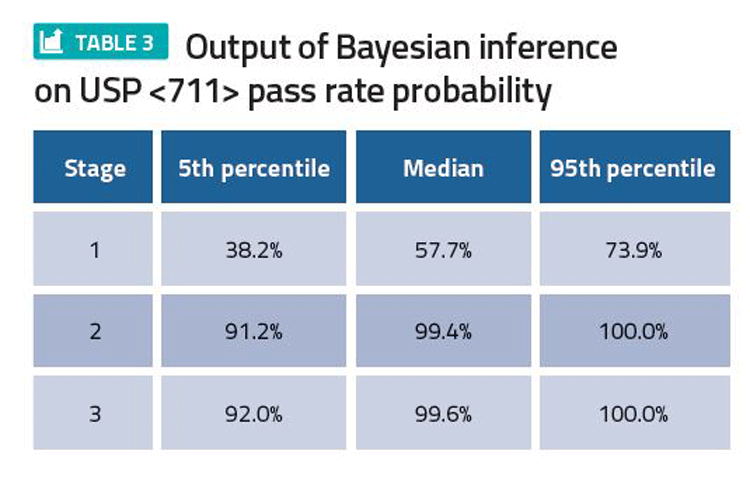
Based on available data, the current best estimate of pass rates at stage 1, 2 and 3 of USP <711>, and the uncertainty around these estimates, can be calculated, quantifying the risk of proceeding onto stage 2 testing or batch failures in future commercial manufacturing (Table 3). The resulting 5th percentile, median and 95th percentile provide lower, central and upper estimates of pass rate, respectively. The predicted pass rates can be used for risk assessment.

Conclusions and recommendations
The aim of the method development process is to design a discriminatory test and specification with an acceptable level of analytical testing. The ideal situation is to have biorelevant dissolution methods and in vivo data to support the specification set. This article has discussed different methods of setting CRS using the in vitro data of clinical batches (pre-commercial manufacturing) and the commercial data (assessing capability of the commercial manufacturing process). The first pre-commercial method discussed was f2, which uses relevant clinical batches as representing safe and efficacious in vivo behaviour. Individual or multiple clinical batches can be used as references against which upper and lower f2 bound limits could be applied. These define clinically-relevant dissolution spaces. In order to set a specification, a single summary time point on the f2 lower bound is selected. An alternative method is tolerance intervals. Another tool for selecting the specification timepoint is to use the dissolution rate of change, which will indicate the sensitivity of the chosen timepoint. The second part of the article focused on assessing the proposed specification. Using commercial data, the discriminatory ability of the chosen Q value and time point can be assessed using a contingency table. A discriminating specification is one where there are small false negative and false positive values. Before commercial manufacturing commences, the estimated stage 1, 2 and 3 pass rates for USP <711> based on the proposed specification can be estimated via the Bayesian method.2 Their results can be used to understand risk in terms of commercial pass rates and analytical burden.
References
1. Clinically Relevant Specifications (CRS): A Regulatory Perspective. Richard (Rik) Lostritto, Ph.D. Acting Deputy Director for Science & Policy and Acting Biopharmaceutics Lead, Office of New Drug Quality Assessment (ONDQA) CDER/FDA
2. LeBlond D, Mockus L. (2014). The posterior probability of passing a compendial standard, part 1: uniformity of dosage units. Statistics in Biopharmaceutical Research, 6(3), 270-286
Biography


The rest of this content is restricted - login or subscribe free to access


Why subscribe? Join our growing community of thousands of industry professionals and gain access to:
- bi-monthly issues in print and/or digital format
- case studies, whitepapers, webinars and industry-leading content
- breaking news and features
- our extensive online archive of thousands of articles and years of past issues
- ...And it's all free!
Click here to Subscribe today Login here


