

Near-infrared spectroscopy has grown up and moved from the lab to its own place
Posted: 27 February 2019 | Emil W. Ciurczak | 1 comment
For decades, near-infrared (NIR) spectroscopy has been an invaluable tool within the laboratory and, interestingly, despite all the excellent instrumentation and technologies introduced for process control, NIR is still the most popular and mature technique available. This article will discuss the impact of NIR in pharmaceuticals from the perspective of Emil W. Ciurczak, a pioneer for NIR in the pharmaceutical industry.

For decades, near-infrared (NIR) spectroscopy has been an invaluable tool within the laboratory. The development of portable instruments, or ones used in a specific vicinity (a silo for grain, a tablet press for pharmaceuticals) has seen little change in the basic theory. However, the hardware and software has changed dramatically.
I recently touched on the improvements to process spectrometers (European Pharmaceutical Review, 23(3), 2018, 22-25). This article will discuss the impact of near-infrared (NIR) on the pharmaceutical industry.
The first question should be: “Why is the pharmaceutical industry the last to have meaningful process controls?” The answer is two-fold:
Profit-margin. Most industries work with marginal profit margins. A typical retail food supplier can work with a 1-3 percent profit and, in some industries (polymers), certain products are sold at a loss – for example, polyethylene – to entice a customer to buy the higher priced products – for example, Large pharmaceutical companies have traditionally made a tidy profit on their products, despite claims of R&D expenses, etc.
Thus, the food, polymers, paper products and bulk chemical industries all needed to eliminate waste and speed up their process to stay in competition with other companies. While a drug is under patent, pharma companies could charge a price that covered outmoded processes (basically unchanged since the 1960s) and after-the-fact analyses – often HPLC, simple wet methods or BP/USP-based – avoiding the cost and effort of modernising analysis methods.
Regulations/laws. This is a catch-all topic. There are always current good manufacturing practices (cGMP) outlining the minimum requirements for any manufacturer of drug products. These are laws, but they are, of course, open to interpretation. The original Pure Food & Drug Act merely states that a drug should be “pure and safe.” A rewrite added “effective.” These words leave room for interpretations.
We can break down these regulations/laws into Agency and Country (state): we cannot ignore the US FDA or EMA regulations. However, even defined and redefined regulations are sometimes vague. For example:
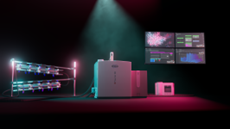
Figure 1: Multiple fibre-optic channels for Indatech unit
i) “Perform ‘meaningful’ in-process tests” is fairly open. When this was written, the available “in-process” tests were limited: friability, hardness and disintegration were the popular, and often only, choices. Sadly, for reasons of “hand-me-down” teaching of new operators or reluctance to spend money, these are still the most common tests. The problem is they are not timely – many tablets are pressed during the testing, so there is no meaningful feed-back – fast or meaningful. However, the results fill spaces on Master Manufacturing Formulas for QA to peruse.
ii) GMP requires a “statistically meaningful number of final dosage forms” to be analysed for product release. I’m no statistician, but 20-30 samples out of a 1,000,000 to 5,000,000 tablet lot doesn’t seem very “meaningful” to me. Clearly, the cost of performing HPLC on thousands of samples would burden even the largest pharma companies and bankrupt smaller houses. The Agencies “whistle past the graveyard” on this regulation, hoping no one notices an important piece of GMP wasn’t enforced.
iii) When the PAT Guidance was introduced in draft form, the consternation among QA offices was (predictably) loud and unified. They were appalled by concepts such as “use your best scientific judgement” and “each batch is a validation batch.” Don’t even get me started on the idea of “Design Space” – where the operators are allowed (and expected) to make real-time changes in the process to affect change, to force the product to be made with the “proper” attributes (hardness, density, API content, possibly even dissolution profile).
State/country laws are often imposed on top of overall agency rules.
i) Countries, such as Canada, use nation-wide negotiating of drug prices, significantly lowering them compared with, for example, the United States where Medicare and each state or health insurance company negotiates drug prices, making them significantly higher for consumers.
ii) Some countries – for example, Germany – will not allow expensive new drugs on the market unless they can prove superiority over products already available. This can cut into the never-ending pipeline that large pharma depends upon to survive.
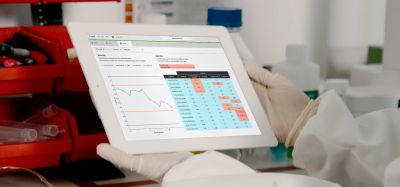
Figure 2: Data seen graphically from rapid analyses of vials.
Now, what does all of this have to do with NIR? Despite all the excellent instrumentation and technologies introduced for process control, NIRS is still the most popular and mature technique available. The technology was embedded in the lab when I discovered it in the early 1980s. Early attempts to expand the instrumentation available to field work in agriculture, textiles and, of course, pharmaceuticals consisted of sampling from bulk and bringing samples to a secure instrument.
The first attempt to bring the instrument to the samples was made by Bran+Leubbe (formerly Technicon); they hardened the lab unit and placed it on a cart, equipped it with a fibre-optic probe, and entered the warehouse to measure incoming raw materials. The earliest on-board unit was developed at Pfizer (UK) by Zeiss (Switzerland) to follow the blending of powders for solid dosage forms. Companies like NIRSystems (later Perstrop, then Foss) even converted their lab units into “process” monitors.
In all these cases, existing units were “hardened,” given an on-board power supply – and later WIFI – re-designed for purpose, but not essentially different from the lab instruments. In fact, the $50-70,000 price tag on lab units could increase by another $40,000 for the explosion-proof case for conversion. Multiple fibre-optic cables (reinforced for industrial use) cost between $1-10,000 per metre to install (each; and there were often six or eight).
Figure 3: Automated line to both measure and discard OOS dosage forms.
Smaller units, with voltages in the 6-12V range, slowly replaced the 120V (or 220V, for Europe) units. Many were portable, hand-held and had varying levels of accuracy and precision, depending on the need or technology used. Acousto-optic tunable filters, diode-arrays, and MEMS (Microelectromechanical Systems) were seen to be fast, sturdy, and less expensive than the traditional grating-based or interferometer-based systems. Hand-held were somewhat expensive and not easily affixed to production lines., They also had limited software on-board.
However, as more and more companies accepted PAT and QbD, there arose economic openings for instrument and software suppliers to supply the “engines” of process control. Another parallel technology to “traditional” NIRS is chemical imaging, where the entire sample is scanned simultaneously, generating data on all the ingredients within the sample; as well as qualitatively, what is there; quantitatively, how much of each; spatially, where each component is located; and other parameters, such as agglomeration and particle size distribution.
The first full-information-generating unit was supplied by Spectral Dimensions (Maryland, USA, later supplied by Malverne, UK). This unit generated (up to) 80,000+ pixels of full-spectrum information. The data-cube, as it was named, contained all the information outlined in the previous paragraph. It was wonderful for development or OOS investigations, but each data cube took several minutes to generate; hardly a practical process tool. It was also high-priced (near €500,000, prior to being discontinued), which deterred smaller companies from indulging in one. Additionally, its speed (or lack thereof), meant that it was impractical for real-time process control.
A different, dynamic approach was developed by VTT (Technical Research Centre of Finland, Ltd), named “push-broom” scanning. Early units were not as popular, since they were designed (as per tradition) for static settings – or lab use. The sample or scanning part needed to move, since it measured a slice of the sample over time, adding the results in a 3D “spectral picture”. However, researchers1 showed that tablets “relax” over the 24–72 hours after the compression process. This resulted in chemometric manipulation of samples scanned in a lab setting, in order to be able to predict freshly pressed doses. This helped convince several workers to pursue in-line analyses.
To make a long story short(er), combining the push-broom technology fibre-optics allowed processes to be monitored in real time. A particularly nice unit is built by Indatech (Clapiers, France), which uses multiple heads to illuminate each tablet, capsule, or vial (Figure 1). The data returned contains qualitative and quantitative information (Figure 2 shows a graphic representation of data from vials). Figure 3 demonstrates how individual doses, deemed OOS, may be rejected by a directed air stream, immediately after the measurement site. The unit can measure up to 100,000 tablets/capsules per hour per fibre-optic head.
While this control is remarkable, similar measuring devices along a process stream make numerous chemical and physical measurements. These begin with multiple weighing points in a continuous manufacturing site. These data need to be processed in a rapid, integrated manner. One software suite is provided by IRIS (Innovació I Recerca Industrial I Sostenible, Barcelona, Spain). The general architecture is shown in Figure 4. This shows how the system utilised “the cloud” for data storage and computation at several locations, either in a single plant or multiple sites.
Figure 4: IRIS cloud-based PAT control system
Conclusions
The simultaneous development in NIR hardware and software has enabled the technology to “move from its parents’ house” and start a new chapter. No longer is NIR an interesting lab device with “potential” for process applications; it has moved from restructuring older, lab-based units to units designed from inception for application to dynamic processes.
Author Biography
 EMIL CIURCZAK holds advanced degrees in chemistry from Rutgers and Seton Hall Universities and has worked in pharma since 1970 developing lab and process analytical methods. He is a pioneer for near-infrared (NIR) for the pharmaceutical industry, first introducing it at Sandoz in 1983. He has published over six dozen articles in refereed journals, 300 magazine columns, and presented over 200 technical papers.
Emil contributes a column to various pharmaceutical publications and has written and edited several texts and chapters: “Handbook of NIR Analysis” (4th edition in progress), “Pharmaceutical and Medical Applications of NIRS” (1st & 2nd editions), “Molecular Spectroscopy Workbench,” and chapters on NIR applications to life sciences.
References
1. McGeorge G, Macias K, Jayawickrama, D. The Impact of Elastic Recovery on Near-Infrared Tablet Predictions. American Pharmaceutical Review. 2011, 14 (7)
Issue
Related topics
Analytical techniques, Imaging, Lab Automation, Lab Equipment, Near Infrared Spectroscopy (NIR), Technology


Nice article Emil, great to see a reference to the early Technicon system! I remember it fondly, integrating sphere in a probe! Until recently I had a marketing photo of it, if I remember correctly it was called the AdAApt (or some play on adapt) since could be installed on an InfraAlyzer 500. (The AA in all their names was a tribute to their continuous flow analyzer system, the AutoAnalyzer.