Real-time environmental monitoring: PAT solutions using rapid microbiological methods
Posted: 30 July 2009 | Dr Michael J. Miller | No comments yet
In these economic times the pharmaceutical industry has expressed a renewed interest to explore ways in which to enhance the efficiency and agility of existing and future manufacturing processes. This is also true for laboratory-based operations that support forward processing and product release decisions. One function that can greatly benefit from implementing more efficient testing platforms and realise a significant return on investment (ROI) is the QC microbiology lab. This is especially apparent when the laboratory replaces conventional growth-based microbiology procedures with more efficient rapid microbiological methods (RMMs).
Rapid microbiological methods (RMMs) offer tangible technical benefits when compared with conventional methods, such as significantly faster time to result or results in real-time, greater accuracy, precision, sensitivity and reproducibility, single cell detection, enhanced detection of stressed and VBNC organisms, increased sample throughput and automation, continuous sampling, and enhanced data handling and trend analysis1,2. Significant efficiencies and potential cost savings may also be realised if we utilise RMMs that can reduce or eliminate labor-intensive activities, the cost per test, and the overhead associated with operating a laboratory. I recently presented case studies that illustrated how a company can use ROI and payback period models to financially justify the implementation of a RMM for environmental monitoring3,4. In these papers, I described the BioVigilant® IMD-ATM, a real-time optical spectroscopic technology that continuously monitors both viable and nonviable particles during active air sampling. The cost savings over a 5-year period were determined to be between $12MM and $34MM USD, and this was attributed to the elimination of manual sampling and laboratory testing, no consumables, reagents or media, and reducing the potential for rejecting an entire batch when a viable count excursion is detected in real-time. Most importantly, this technology represents a true process analytical technology (PAT) opportunity by shifting microbiology testing in the laboratory to real-time, in-process monitoring on the manufacturing floor. Because the ROI paper did not go into detail about the technology, the current article will discuss the science behind the IMD-A instrumentation and provide an overview of a case study in the evaluation of the instrument in a variety of isolator environments. Additionally, I will present an overview of a second RMM technology, the Chemunex Scan® RDI, which detects and quantifies airborne microorganisms after they have been collected in a liquid impingement sampler.
The IMD-A Technology
The IMD-A is based on Mie-scattering, in which scattered light is concentrated in a forward direction, and the scattered portion of the light is proportional to the particle size. When airborne particles are processed through the IMD-A, the system detects, sizes and quantifies particles within a 0.5-15 μm range. At the same time, the particles pass through a 405-nm laser, and any particles that are of biological origin, such as bacteria, yeast, and spores, will autofluoresce due to the presence of NADH, riboflavin, and dipicolinic acid.
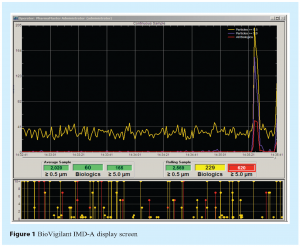
An example of the IMD-A data display screen is shown in Figure 1. Data is acquired instantaneously and the system is capable of analysing a single volumetric air sample or operating in a continuous monitoring mode. Air is sampled through the inlet port located on the top of the instrument, and is expelled through two outlet ports located on the lower side panel. An external laptop computer controls the instrument using BioVigilant’s PharmaMaster™ control and analysis software. As data is acquired, the viable and nonviable particle counts are added to the display screen in real-time. The lower screen in Figure 1 represents the number and size distribution of viable particles and total particles (shown in red and yellow, respectively). Every 1 second, the data from the lower screen is transferred to a continuous time chart of viable particles (shown in red) and nonviable particles ≥0.5 μm and ≥5.0 μm (shown in yellow and blue, respectively) in the upper screen. In the event of an active air excursion, the user would expect to see a rapid increase in particle counts, as can be seen at the right side of the upper display. The rolling sample data (right side numbers) represent the cumulative particle counts in a user-defined volume of air (e.g., 1 m3) at any given time during sampling, and the average sample data (left side numbers) represent the average particle counts for all acquired data (from the start of the monitoring run) per volume of air. Green boxes represent data that are within acceptable levels (these can be pre-configured by the user), yellow boxes correspond to data that have exceeded alert levels, and red boxes denote data that have exceeded action levels. A more comprehensive description of the technology may be found in the Encyclopedia of Rapid Microbiological Methods5.
Evaluation of the IMD-A in Manufacturing Isolators

The ability of the IMD-A to simultaneously and continuously detect viable and nonviable particles in a variety of isolator environments was assessed in a comprehensive study that was recently published in the PDA Journal6. Excerpts from this evaluation are presented in the current paper. The isolators were located in a pilot facility for parenteral product development activities and the surrounding environment was unclassified and not controlled for viable or nonviable particulates. The sample size for these studies was set at one cubic meter of air, which is the volume at which the European Commission7 and the FDA8 set active air monitoring acceptance levels. Action levels for nonviable and viable particles were manually configured within the IMD-A software to reflect current expectations for an ISO 5 (Class 100, Grade A) environment. Alert levels were arbitrarily chosen that were slightly lower than the action levels for the nonviable particles. The viable particle alert level was the same as the action level.
Static Monitoring of Transfer and Filling Isolators
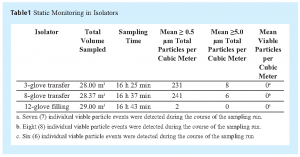
The studies assessed the ability of the IMD-A to detect viable and nonviable particles during static monitoring of 3-glove and 8-glove transfer isolators and a 12-glove filling isolator. Sampling was accomplished using a Teflon sampling tube supplied by the vendor. Recovered particle counts for continuous 1-m3 air samples are shown in Table 1. For all isolator runs the nonviable counts were well within the expected recoveries for an ISO Class 5 area for both 0.5-μm and 5.0-μm particles (3520 and 20 particles per cubic meter of air, respectively, as per FDA and EU guidelines).
The mean viable particle count per cubic meter of air was zero (0) for all of the isolators evaluated during these studies, and the results are aligned with EU Annex 17 guidelines that allow an average active air level < 1 cfu per m3 air. These results are also consistent with similar data reported by Bhupathiraju et al9, where no viable counts were detected in a Grade A cleanroom environment when 35 L (0.035 m3) of air were monitored using the IMD-A. However, during the current studies, where at least 28 m3 of air were sampled, the instrument detected a very low level of individual viable particle events even though the reported mean count was zero particles per cubic meter. Seven (7) viable particles were detected during the 3-glove transfer isolator run, eight (8) events occurred during the 8-glove transfer isolator run, and six (6) events occurred during the filling isolator run. Similar results were reported during the continuous monitoring of unclassified laboratory air through an in-line cartridge HEPA filter, where low levels of viable particles were also detected10. In the current study, the viable particle detection events were random across the continuous monitoring period (more than 16 h) for all three isolators, and a subsequent review of the raw data demonstrated that each event was attributable to a single viable particle being detected, ranging in size between 0.5 and 1.0 μm.
These results contradict what the industry has historically observed within aseptically-controlled areas (i.e., typically no detection of viable particles within ISO Class 5 environments). One explanation for why an extremely low level of viable particles was detected in the current studies is that the IMD-A platform is a more sensitive technology for the detection of microorganisms as compared with growth-based methods, especially for viable but non-culturable, or VBNC organisms. The IMD-A detects microorganisms based on the presence of cellular viability markers, namely, riboflavins, NADH, and dipicolinic acid, instead of relying on the same microorganisms having the ability to grow on agar media. If we assume that a proportion of the airborne microorganisms collected during our studies were physically stressed or in a VBNC state, then this may explain why we observed low levels of viable particles in an ISO Class 5 environment when we would historically observe no colonies on agar medium (from the same area). A second explanation centers on collection efficiency of airborne particles. The IMD-A concentrator provides a substantially higher experimental collection efficiency and a lower experimental cut-off (d50) size than most conventional bioaerosol samplers10. Finally, it should be noted that the room where these isolator studies were carried out was uncontrolled and unclassified, and the number of viable particles may have been higher than the environment that manufacturing isolators would normally be placed in. Furthermore, HEPA filters are not 100% efficient, and the sizes of the viable particles detected in these studies fall within the same particle size range that we currently allow to be present for nonviable particles in ISO 5 HEPA-filtered environments. Therefore, one could consider that very low levels of viable particles may have always had the potential for gaining access into HEPA-filtered environments, and the IMD-A technology is capable of detecting and quantifying these particles in real time. Agalloco and Akers state that although isolators are superior to a staffed cleanroom with regard to excluding microbial contamination, isolators are not perfect, and despite any decontamination treatment they are given they cannot be considered sterile11. In any case, the numbers presented in this paper are specific to the isolators that were evaluated under the conditions stated in this manuscript, and firms may actually find that monitoring their isolators (or cleanrooms) with the IMD-A may continue to yield zero (0) viable counts, even when monitoring occurs continuously over extended periods of time.
These results bring up an interesting question: if, in the course of using the IMD-A for continuous monitoring, a viable count is observed when historically a zero (0) count was expected on an agar plate, should there be any concerns and is there potential regulatory impact to this finding? To answer these questions, we need to understand the current regulatory position on active air monitoring and acceptance levels. First, the air classification footnote in the FDA Guidance for Industry8 states that the numbers for recovered viable particles during active air monitoring represent recommended levels of environmental quality, and it may be appropriate to establish alternate microbiological action levels due to the nature of the operation or method of analysis. Next, Benda Uratani, a noted FDA compliance officer and microbiologist, indicated (during the 2007 PDA global microbiology conference) that the FDA expects higher counts will be recovered when using rapid microbiological method technologies, especially if the methods are more sensitive than conventional methods, and if a firm uses a rapid method for air monitoring, the 1-cfu/m3 specification may be changed, because this was originally based on the less sensitive, agar-based method12. During a discussion on continuous air monitoring at the 2008 PDA/EMEA meeting, MHRA Paul Hargreaves implied that more excursions are found as all events are now being monitored, and that alert limits and out-of-trend limits may need to be revised13. Finally, a publication by FDA review microbiologists Hussong and Mello states that the implementation of newly developed, or more rapid, microbiology methods may also require establishment of new acceptance criteria, as previous acceptance criteria may not be applicable14. Therefore, if a firm wishes to use a more sensitive rapid method for environmental monitoring, and through validation studies it is determined that the new baseline for viable counts is higher than zero, the data generated may be used to scientifically revise the acceptance criteria that are currently being used for the growth-based recovery of viable particles.

The Chemunex Scan RDI
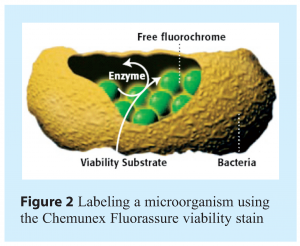
A second RMM technology that is now being used for the rapid detection and quantification of airborne microorganisms is the Chemunex Scan RDI. This is a system that has been in use for more than 10 years for the enumeration of microorganisms in filterable samples, such as purified water, in-process materials and finished product. The recent availability of novel liquid impingement systems, such as Bertin Technologies’ Coriolis® μ air sampler, allows captured microorganisms from cleanroom environments to be filtered onto Chemunex’s solid support membrane, labeled with a fluorescent viability marker and detected by a laser in the Scan RDI. Fluorescent labeling of microorganisms on the filter is achieved using a specifically developed viability label that is a derivative of fluorescein (Chemunex Fluorassure). During the labeling step the non-fluorescent substrate passively diffuses across the cell membrane, is cleaved by non-specific esterase enzyme activity in the cell and the charged fluorescein molecule accumulated. The label differentiates between viable and dead cells on the basis of two criteria: (a) the presence of esterase activity within the cell, and (b) the requirement for an intact cell membrane to retain the charged fluorescein molecules. An illustration of how staining occurs in the cell is shown in Figure 2. After labeling, the membrane is placed into the Scan RDI instrument and the laser scan is initiated. During laser scanning, as the laser spot passes over a fluorescent object, photo-multiplier tubes will detect the emitted fluorescent light, and the software will analyse the data and determine if the fluorescent signal originates from labeled viable microorganisms. When the scan has completed, the results are displayed as a direct viable cell count. The time to result using the Scan RDI is approximately 90 minutes from when the liquid from the air sampling system is filtered and the viability staining procedure is initiated. Although the Chemunex Scan RDI does not provide environmental monitoring data in real-time (as does the BioVigilant IMD-A), the system represents yet another opportunity for the industry to use a rapid technology for the detection and enumeration of airborne microorganisms.

Summary
An environmental monitoring programme should be meaningful, manageable, and defendable15. The program should also provide information about the state of control in the production environment, be capable of reporting the data and corresponding trends, utilise scientifically sound and justifiable methods, and meet the appropriate regulatory expectations. From a manufacturing control perspective, environmental monitoring data should be capable of detecting an adverse drift in environmental conditions in a timely manner that would allow for meaningful and effective corrective actions to be undertaken16. Here lies the challenge; all conventional environmental monitoring methods are based on the growth or microorganisms, and the time required for colony forming units (CFUs) to appear on an agar plate cannot be considered timely. Today, when an adverse event occurs (i.e., an excursion of CFUs as compared with established acceptance levels) we can only be reactive in understanding why the event happened, and most of the time, our investigations lead to no definitive cause. Therefore, we need to move the detection of microorganisms upstream to the point of manufacturing in order to monitor and control our processes in real-time. For these reasons, the industry should look toward the introduction of more sensitive, real-time or close to real-time, and continuous environmental monitoring technologies with the ability to track and trend an increased incidence of microbial contamination over a period of time. This paper has demonstrated that the BioVigilant IMD-A is capable of fulfilling these requirements, and that other RMM technologies may also provide the means to quickly assess the state of microbial control in our manufacturing environments. Additionally, these systems now allow us to utilise next generation microbiology technologies to find ways of mitigating risk while facilitating continuous improvement and innovation in pharmaceutical manufacturing. From a microbiology perspective, this is truly a step in the right direction for implementing real PAT solutions for contamination control within our industry.
Acknowledgements
The author acknowledges Michael R. Walsh, Ph.D., Jerry R. Shrake, Randall E. Dukes and Daniel B. Hill of Eli Lilly and Company for their assistance and expertise during the execution of the BioVigilant IMD-A studies.
References
- Miller, M.J. Rapid microbiological methods in support of aseptic processing. In Practical Aseptic Processing: Fill and Finish Volume 2. Lysfjord, J., Ed.; DHI Publishing, River Grove, Illinois and PDA, Bethesda, Maryland: 2009, 169-219.
- Encyclopedia of Rapid Microbiological Methods Volumes 1-3; Miller, M. J., Ed.; DHI Publishing, River Grove, Illinois and PDA, Bethesda, Maryland: 2005.
- Miller, M.J. Quality risk management and the economics of implementing rapid microbiological methods. Eur. Pharm. Rev. 14 (2), 66-73. 2009.
- Miller, M.J. Ensuring ROI from your RMM. Pharmaceutical Manufacturing. 8 (6), 32-35. 2009.
- Jiang, J. P. Instantaneous microbial detection using optical spectroscopy. In Encyclopedia of Rapid Microbiological Methods Volume 3; Miller, M. J., Ed.; DHI Publishing, River Grove, Illinois and PDA, Bethesda, Maryland: 2005, 121–141.
- Miller, M.J.; Walsh, M.R.; Shrake, J.L.; Dukes, R.E.; Hill, D.B. Evaluation of the BioVigilant IMD-A, a novel optical spectroscopy technology for the continuous and real-time environmental monitoring of viable and nonviable particles. Part II: Case studies in environmental monitoring during aseptic filling, intervention assessments and glove integrity testing in manufacturing isolators. PDA J. Pharm. Sci. Technol. 63 (3), 258 –282. 2009.
- European Commission. EU Guidelines to Good Manufacturing Practice, Annex 1. Manufacture of Sterile Medicinal Products. EudraLex, European Union: Brusselles, Belgium, 2008. Available at http://ec.europa.eu/enterprise/pharmaceuticals/eudralex/vol-4/pdfs-en/2008_02_12_gmp_annex1.pdf.
- Food and Drug Administration (FDA). Guidance for Industry: Sterile Drug Products Produced by Aseptic Processing—Current Good Manufacturing Practice. U.S. Department of Health and Human Services, FDA: Rockville, MD, 2004. Available at http://www.fda.gov/cber/gdlns/ steraseptic.pdf.
- Bhupathiraju, V. K.; Varnau, B.; Nelson, J. R.; Jiang, J. P.; Bolotin, C. Evaluation of an instantaneous microbial detection system in controlled and cleanroom environments. BioPharm Int. 20, 35– 46. 2007.
- Miller, M. J.; Lindsay, H.; Valverde-Ventura, R.; O’Conner, M. J. Evaluation of the BioVigilant IMD-A, a novel optical spectroscopy technology for the continuous and real-time environmental monitoring of viable and nonviable particles. Part I. Review of the technology and comparative studies with conventional methods. PDA J. Pharm. Sci. Technol. 63 (3), 244 –257. 2009.
- Agalloco, J.; Akers, J. E. Aseptic processing: A vision of the future. Pharm. Technol. 29 (Suppl.), 16 –23. 2005.
- Uratani, B. Connecting Science and Regulation. 2007 PDA 2nd Annual Global Conference on Pharmaceutical Microbiology. Bethesda, MD, October 31, 2007.
- Hargreaves, P. Revised EU GMP Annex 1. 2008 PDA/EMEA Joint Conference. Budapest, Hungary, February 20, 2008.
- Hussong, D.; Mello, R. Alternative microbiology methods and pharmaceutical quality control. Am. Pharm. Rev. 9, 62-69. 2006.
- Moldenhauer, J. Environmental Monitoring, A Comprehensive Handbook; Moldenhauer, J., Ed.; DHI Publishing: River Grove, IL and PDA: Bethesda, MD, 2007; Vol. 1 and 2.
- United States Pharmacopeia, USP 31-NF26. General Information Chapter <1116> Microbiological Evaluation of Clean Rooms and Other Controlled Environments. U.S. Pharmacopeial Convention: Rockville, MD, 2008.
Issue
Related topics
Environmental Monitoring, Microbiology, Process Analytical Technologies (PAT), Rapid Microbiological Methods (RMMs)


