Drop-coating deposition Raman spectroscopy for metabolite profiling
Posted: 3 January 2019 | Anik Alam, Derya Cebeci, Dor Ben-Amotz | No comments yet
There has been a lot of interest in enhancing the sensitivity of Raman spectroscopy due to the low efficiency of the Raman technique. A pre-concentration technique, drop-coating deposition Raman (DCDR), has been used in recent years to increase the utility of Raman spectroscopy by decreasing the detection limit for non-enhanced Raman detections.
In a typical implementation of DCDR, a small volume (in the μL to nL range) of a dilute solution is preconcentrated by being dried on a special hydrophobic plate. DCDR uses the coffee-ring drying pattern to pre-concentrate the weak Raman scatterers prior to their analysis with Raman.1 The enhancement in the detection limit is obtained due to the formation of concentrated residue upon drying. For maximum efficiency of DCDR, the substrate should have certain properties, such as high solvophobicity (to a wide range of solvents), low optical absorbance, high reflectance, and no background and non-wetting interaction with the deposit.2 The non-wetting property is particularly critical because it is necessary to confine the ring to a small area to create a concentrated deposit. A wetting substrate would spread the solution to a larger area, thus producing a larger ring and resulting in less dense analyte deposits. In the studies presented here, gold-coated substrates with these properties are used.
DCDR has been implemented to obtain high quality non-enhanced Raman spectra from low concentrated protein solutions.2 Zhang et al. showed that the drying process yielded the separation of solutes in the solution. It was demonstrated that, while the buff er salts evaporated around the centre, the protein molecules moved outward to the edge and concentrated on the ring. More specifically, the results of this work can be summarised as: larger solutes tend to deposit in a circular ring at the outer edge of the deposited droplet, while more soluble species tend to deposit in the central region. DCDR can therefore be advantageous as a means of resolving components in mixtures.
Nechaeva et al. used DCDR to increase the sensitivity of the Raman technique to determine thiocholine.3 A limit of detection (LOD) at 260nM was obtained with the Surface Enhanced Raman Spectroscopy (SERS) integrated with the DCDR technique. Filik et al. demonstrated that DCDR spectroscopy can be used for compositional analysis of protein mixtures.4 DCDR was combined with chemometrics techniques to determine the relative protein concentration using only 1.5μL sample volumes. The group also analysed human tear fluid to assess the ability of DCDR to detect the protein, urea, bicarbonate and lipid components of tear samples.5 It was found that the distribution of these components was inhomogeneous, which may be attributable to their solubilities. DCDR technique was also used for the determination of peptide phosphorylation.6 The degree of phosphorylation was quantified using a Partial Least Square (PLS) method with 2 percent prediction error.
In this study, small molecule metabolites are assessed using the DCDR technique. The analysis of metabolites in a biological system provides a detailed insight into the metabolic process of the system. Metabolic disorders play critical roles in the onset and progression of many diseases; therefore, fast, non-invasive measurements of metabolites to diagnose the early onset of diseases are very important for early intervention and timely management of the disease. For example, identifying a certain metabolite as an indicator of a disease could help monitor the progression of the disease or the therapy. Analytical techniques such as mass spectroscopy (MS) and nuclear magnetic resonance spectroscopy (NMR)7-8 are the primary methods used in metabolite analysis.9 While MS is more sensitive (typically 1pg level) and able to determine unknown molecules, NMR generates highly reproducible data, which is easily quantified. However, NMR data can be difficult to interpret, especially at the low concentration level of metabolites, due to spectral overlap. The increased interest in metabolite profiling calls for improved analytical techniques with greater performance. With this in mind, we evaluated the application of DCDR spectroscopy for the use of metabolite profiling. Detailed work investigating the spectral differences between crystalline, DCDR and aqueous solution forms of various amino acids is described by Pazderka et al.10
Experimental
L-glutamic acid (Sigma-Aldrich, G-1251), DL-alanine (Sigma-Aldrich, A-7502), and sodium L-lactate (Sigma-Aldrich, 365165) are studied with Raman spectroscopy. Solutions at diff erent concentrations were prepared and 10μL of each solution was deposited on gold-coated substrates to be evaporated at room temperature. Gold-coated substrates (CA 134) were purchased from EMF Corporation (Ithaca, NY). A Raman spectrum of a random point on the deposit is collected for each sample.
All measurements are acquired with a Raman system with 1,200 grooves/mm grating, equipped with 633nm HeNe laser with ~21mW power at the sample. 100X objective lens (Olympus, 0.8 N.A) is used for both focusing the laser onto the sample and collecting the scattered Raman light.
Results and discussion
The low detection sensitivity of Raman spectroscopy is a challenge in biomedical applications. In this work we investigated the detection limit for three metabolite solutions with DCDR. White light images in Figure 1 show the residues left on gold substrates after evaporation of each metabolite solution. Metabolites deposited (10μL) onto gold-coated substrates did not produce a coffee-ring pattern on drying, as seen in the figures. Yet, the deposits left after evaporation were still able to produce Raman spectra.
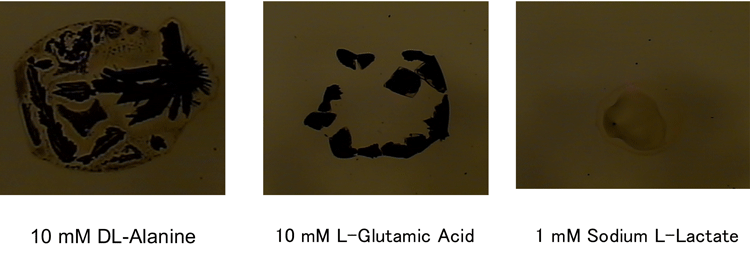
Figure 1: White light images of 10mM solutions of alanine, glutamic acid and 1mM lactate at 2.5x magnification
Here, DCDR has been used to obtain high-quality Raman spectra from small molecule metabolites. Figure 2 depicts the Raman spectra of DL-alanine, L-glutamic acid and sodium L-lactate at three different concentrations obtained from a single location on the deposits on the substrate. Although Raman spectra of 10mM for alanine and glutamic acid and 1mM for lactate solution look essentially like pure water, with no evidence of Raman features from the metabolites, high-quality DCDR spectra of the metabolites were obtained at these concentrations from deposits on the gold substrates. This technique has significantly extended the concentration and small volume detection limits of Raman spectroscopy for small molecule metabolites. The figures illustrate discernible Raman signatures from 300μM solutions. The sharp peak at 853cm-1 was observed in the spectra of 300μM metabolites. The spectra of L-glutamic acid illustrates that a 100μM solution deposit did not produce the peak at 853cm-1 while it was visible in spectra of alanine and lactate. The preliminary Raman spectra in Figure 2 were collected from particular points on the substrate.
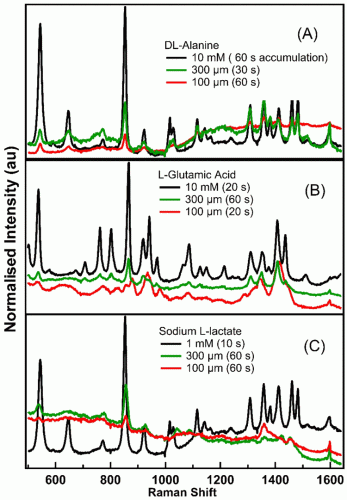
Figure 2: DCDR spectra of metabolites. Each spectrum is normalised to the area
To reach a decisive conclusion, more studies should be carried out, investigating the whole area of the deposit on the substrate. However, based on the preliminary results here, we can conclude that the DCDR technique significantly enhanced the detection limit of Raman spectroscopy for the metabolites investigated.
Biography
 DERYA CEBECI is currently with PortMera (at Technopark Istanbul) as a Research Chemist, applying vibrational spectroscopy and chemometrics to develop real-time measurement systems for at-field screenings and pharma applications. She has a PhD in Analytical Chemistry from Purdue University and holds an MBA degree from Ball State University. Prior to joining PortMera, she worked at FDA and Duquesne University, generating spectroscopy methods for at-field counterfeit screening applications and for continuous pharmaceutical manufacturing.
 DOR BEN-AMOTZ obtained his PhD from UC Berkeley, followed by a postdoctoral fellowship with Dudley Herschbach at the Exxon Corporate Research Lab in Annandale, NJ. He has been a faculty member in the Department of Chemistry at Purdue University since 1989. His recent experimental and theoretical interests include hydration-shell spectroscopy, liquid theory, hyperspectral compressive imaging, and new ways of teaching physical chemistry.
 ANIK ALAM obtained his PhD in Pharmaceutics from Duquesne University. He has gained expertise in vibrational spectroscopy and chemometrics for pharmaceutical analysis. His research activities also include the implementation of process analytical technology and quality by design principles in pharmaceutical manufacturing set-ups to monitor and control unit operation processes.
References
1. Deegan RD, Bakajin O, Dupont TF, Huber G, Nagel SR, Witten TA. Capillary flow as the cause of ring stains from dried liquid drops. 1997. 389 (6653), 827-829.
2. Zhang D, Xie Y, Mrozek MF, Ortiz C, Davisson VJ, Ben-Amotz D. Raman Detection of Proteomic Analytes. Analytical Chemistry. 2003. 75 (21), 5703-5709.
3. Nechaeva N, Prokopkina T, Makhaeva G, Rudakova E, Boltneva N, Dishovsky C, Eremenko A, Kurochkin I. Quantitative butyrylcholinesterase activity detection by surface-enhanced Raman spectroscopy. Sensors and Actuators B: Chemical. 2018. 259, 75-82.
4. Filik J, Stone N. Drop coating deposition Raman spectroscopy of protein mixtures. Analyst. 2007. 132 (6), 544-550.
5. Filik J, Stone N. Analysis of human tear fluid by Raman spectroscopy. Analytica Chimica Acta. 2008. 616 (2), 177-184.
6. Xie Y, Zhang D, Jarori GK, Davisson VJ, Ben-Amotz D. The Raman detection of peptide tyrosine phosphorylation. Analytical biochemistry. 2004. 332 (1), 116-121.
7. Zhang S, NaganaGowda GA, Ye T, Raftery D. Advances in NMR-based biofluid analysis and metabolite profiling. Analyst. 2010. 135 (7), 1490-1498.
8. Appiah-Amponsah E, Shanaiah N, Nagana Gowda GA, Owusu-Sarfo K, Ye T, Raftery D. Identification of 4-deoxythreonic acid present in human urine using HPLC and NMR techniques. Journal of pharmaceutical and biomedical analysis. 2009. 50 (5), 878-885.
9. Pan Z, Raftery D. Comparing and combining NMR spectroscopy and mass spectrometry in metabolomics. Analytical and Bioanalytical Chemistry. 2007. 387 (2), 525-527.
10. Pazderka T, Kopecký V. Drop coating deposition Raman spectroscopy of proteinogenic amino acids compared with their solution and crystalline state. Spectrochimica Acta Part A: Molecular and Biomolecular Spectroscopy. 2017. 185, 207-216.
The rest of this content is restricted - login or subscribe free to access
 Thank you for visiting our website. To access this content in full you'll need to login. It's completely free to subscribe, and in less than a minute you can continue reading. If you've already subscribed, great - just login.
Why subscribe? Join our growing community of thousands of industry professionals and gain access to:
- bi-monthly issues in print and/or digital format
- case studies, whitepapers, webinars and industry-leading content
- breaking news and features
- our extensive online archive of thousands of articles and years of past issues
- ...And it's all free!
Click here to Subscribe today Login here