Recent developments of Raman spectroscopy for the qualitative analysis of falsified and substandard medicines
Posted: 2 January 2019 | Charlotte De Bleye (University of Liege Belgium), Elodie Dumont (University of Liege Belgium), Eric Ziemons (University of Liege Belgium), Hermane Avohou (University of Liege Belgium), Laureen Coic (University of Liege Belgium), Philippe Hubert (University of Liege Belgium), Pierre-Yves Sacre (University of Liege Belgium), Riccardo Deidda (University of Liege Belgium), Roland Marini (University of Liege Belgium) | No comments yet
Quality medicines are essential to any healthcare system and are the final goal of any pharmaceutical manufacturer. Unfortunately, as stated recently by the World Health Organization (WHO), one in 10 medical products circulating in low and middle-income countries is either substandard or falsified (SF products).1 Although the exact prevalence of SF products is unknown in high-income countries, it remains a major risk,2 especially because the internet market is difficult to control.3

BROADLY speaking, marketed medicines are expected to be compliant with local market specifications. These specifications ensure the correct active ingredient (identity testing) is present in the right amount (assay testing); the active pharmaceutical ingredient (API) is bioavailable (dissolution testing); and the amount of impurities is low enough (impurity testing). Although it is sometimes possible to visually identify SF products, only the pharmaceutical product testing following the complete pharmacopoeia monographs ensures the final quality and safety for the patient. However, this testing is lengthy and requires high-level equipment and staff. These limitations reduce the quantity of possibly tested samples and are impossible to implement for field testing during inspections. There is therefore an increasing need for fast, reliable and, if possible, portable solutions to detect SF products.
Various solutions have been proposed and are currently used in the field (eg, GPHF Minilab™), but the number of possibly tested samples remains relatively low due to the need for consumables and analysis time. Raman spectroscopy is increasingly used in the field of SF product testing due to its fast and non-destructive nature. Furthermore, it is possible to analyse samples directly through the blister (except for aluminium blisters). Since both the chemical and physical state of the sample can influence Raman spectroscopy, and the intensity of the Raman scattered signal is dependent on the quantity of scattering chemical bonds, large amounts of qualitative and quantitative information can be drawn from the samples.
Results
Perhaps the first legitimate question when challenging a suspect sample is: “Is the product what it is supposed to be?” This is because, in addition to intellectual property issues, qualitative chemical information is important from a public health point of view. The Raman spectrum of a finished pharmaceutical product is a unique fingerprint of the product. The quality and informative value of the signature depends on the equipment and interface between the spectrophotometer and the sample. Increased laser power and higher spectral resolution provides more resolved and intense spectra, enabling a finer analysis of the sample. Once obtained, the analyst must process the spectral signatures to authenticate the product (typically a pass/fail) or identify the API or combination of APIs. Authentication with Raman spectroscopy is often performed by comparing a previously built (or commercially available) spectral database using the correlation coefficient, Hit Quality Index4 or even p-value. This approach, using weak statistical tools, provides contrasting results and only discriminates largely different products such as no API or the presence of another API.5,6 Small differences between samples, such as discrimination of several generics, requires more advanced chemometrics and class-modelling tools such as Soft Independent Modelling of Class Analogy (SIMCA), which may provide better results. SIMCA uses a collection of spectra of the target class to model its distribution and build a defined probability confidence interval around it. Each new sample is then projected and the distance to the modelled class computed. Samples with distances inferior to a defined threshold value are considered as belonging to the target class, otherwise it is considered an outlier.
The main advantage of one-class modelling over classification algorithms (such as support vector machine or partial least squares) is that it only models the target class, enabling a more robust discrimination of new unknown spectra.7 In addition to the spectrophotometer performance, the interface with samples is also important. Indeed, if Raman signatures are obtained directly through transparent or even opaque plastic blisters, in cases of plastic bottle storage, conventional Raman spectrophotometers will likely return the spectral signature of the plastic bottle and possibly some spectral features of the inner product. To avoid this issue, the spectra can be measured using Spatially Offset Raman Spectroscopy (SORS).8 When performing SORS analyses, a point on the sample is illuminated and the spectrum measure is taken elsewhere (with a calibrated offset). The offset measure mainly constitutes the content (eg, pharmaceutical tablets) spectral features rather than those of the container (eg, plastic of the bottle).
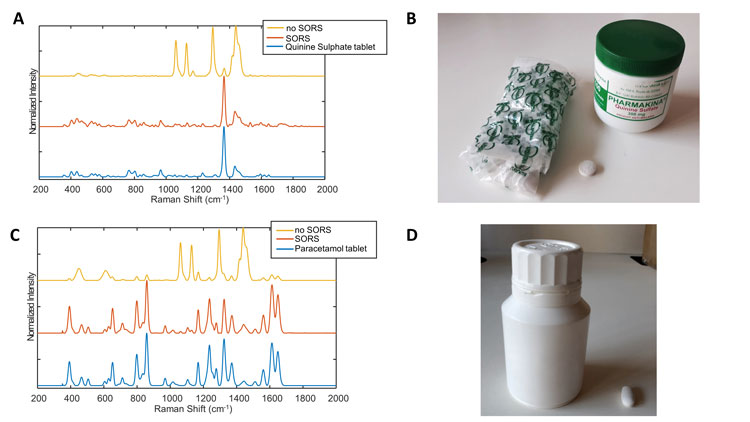
Figure 1: A: Raman spectra of quinine sulphate tablets obtained directly on the tablet and through the container with and without SORS technology. The spectra were measured using Agilent’s Resolve spectrophotometer. The correlation coefficient of the SORS and no SORS spectra with the tablet spectrum were 0.93 and 0.08, respectively. B: Quinine sulphate tablet and container analysed. C: Raman spectra of paracetamol tablets obtained directly on the tablet and through the container with and without SORS technology. The spectra were measured using Agilent’s Resolve spectrophotometer. The correlation coefficient of the SORS and no SORS spectra with the tablet spectrum were 0.96 and 0.04, respectively. D: Paracetamol tablet and container analysed.
Although the technology isn’t new, Agilent (formerly Cobalt Light) recently made a handheld device available on the market under the name Resolve®. Figure 1 shows spectra recorded by the Resolve® on quinine sulphate and paracetamol samples, respectively, in plastic bottles with and without SORS. Results show the “no SORS” spectra are highly contaminated by the plastic features of the bottle and only small spectral features can be attributed to the sample. By contrast, SORS spectra show relatively clean sample spectra. Of note, the position of the sample in the container is crucial to obtain good quality spectra, enabling further analyses. Indeed, relatively close contact between the sample, the container and the spectrophotometer is required to obtain quality spectra. Another limitation of Raman spectroscopy is its poor sensibility and the high interference of fluorescence. To circumvent these two issues, Surface Enhanced Raman Spectroscopy (SERS) can be used. SERS has the capability to both enhance the Raman signal and quench fluorescence interference. Several papers have described the use of SERS substrates with handheld devices to detect the presence of APIs in suspect samples.9,10 However, both approaches needed the dissolution of a fraction of the sample and its mixing with metallic colloids. Therefore, its implementation for on-field analyses is limited due to the sample preparation and stability of the colloidal solutions that has yet to be assessed. In addition to the global spectral signature of the sample, Raman spectroscopy may enable the elucidation of the composition of the suspect tablets using hyperspectral imaging.11,12 Four falsified antimalarial samples were detected using handheld devices and exhibited the same global signature with no trace of the expected API (artemether/ lumefantrine and sulfadoxine/pyrimethamine). Hyperspectral imaging analyses were conducted, and the compositions were elucidated using multivariate curve analysis (MCR-ALS).
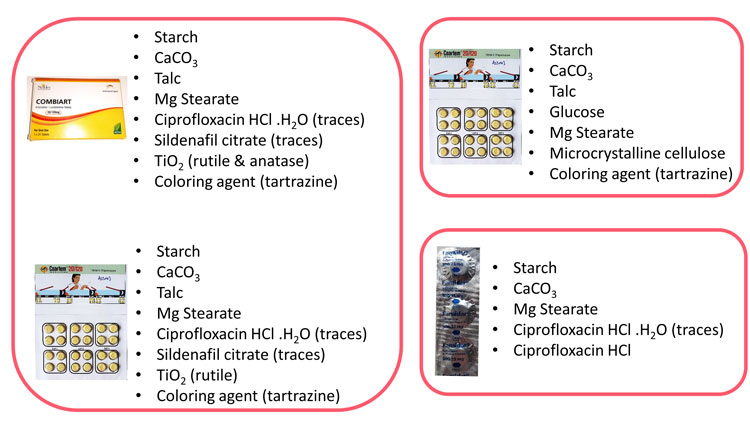
Figure 2: Images of the packaging of the analysed samples. The chemical composition was elucidated using Raman chemical imaging data and MCR-ALS data analysis. The two samples on the left showed similar composition and were considered as related cases, whereas the two samples on the right showed different chemical composition. All four samples exhibited similar average Raman signatures.
Results showed the presence of contaminants (sildenafil, ciprofloxacin HCl and ciprofloxacin HCl monohydrate) at trace levels (Figure 2). Presence of the same contaminants in different samples enabled grouping of the different cases and might aid further forensic investigations. Raman chemical imaging might also help guide future chemical and quantitative analyses to elucidate the nature of the present compounds.
Conclusions
Raman spectroscopy constitutes an essential part of the analyst’s toolbox to characterise and authenticate SF drugs. Raman spectra are relatively easy to interpret compared to near infrared (NIR) spectra, can be directly compared to databases, and inference is easier (eg, identification of a wrong API). Raman spectroscopy is less sensitive to physical factors than NIR, enabling analysis of generics with a single method; however, it is less powerful as an authenticating technique. Among vibrational spectroscopy techniques, Raman spectroscopy has the highest technical developments. These developments intend to overcome the previous limitations of the technique such as poor sensitivity (eg, SERS), fluorescence of samples (eg, SERDS)13 and the possibility to analyse samples through opaque containers (eg, SORS)14 with handheld devices opening the possibility of on-field analyses. However, handheld devices aren’t currently designed for quantitative analyses. Indeed, most devices have automatic analysis time reaching a minimal signal over noise ratio. This decreases the possibility to detect substandard medicines (correct API in a lower amount). Fortunately, several advances have been made (eg, Trutools™ add-on for the Thermo Fisher’s Truscan™) and portable devices offer the possibility to set the analysis time and therefore access quantitative information.
Biography
LAUREEN COÏC graduated with a Bachelor’s and Master’s degree in Chemistry from the University of Bretagne Occidentale in France. She also has a Master’s in Chemometrics. During and after her studies, she participated in several analytical chemistry research projects. She is now conducting a thesis funded by the FEDER, about the “development of vibrational spectroscopic techniques to fight against falsification”.
Authors
| LAUREEN COÏC | PIERRE-YVES SACRÉ Senior Scientist | HERMANE AVOHOU PhD Student |
| RICCARDO DEIDDA PhD Student | CHARLOTTE DEBLEYE Senior Scientist | ELODIE DUMONT PhD Student |
| ROLAND MARINI Associate Professor and WHO Expert | PHILIPPE HUBERT Full Professor | ERIC ZIEMONS Associate Professor |
References:
- WHO, Substandard and falsified medical products, (n.d.). http://www.who.int/news-room/fact-sheets/detail/substandard-and-falsified-medical-products.
- Sammons H, Choonara I. Substandard medicines: a greater problem than counterfeit medicines? BMJ Paediatrics Open. 2017;1(1).
- Baert B, De Spiegeleer B. Quality analytics of internet pharmaceuticals. Analytical and Bioanalytical Chemistry. 2010;398(1):125-136.
- Lee S, Lee H, Chung H. New discrimination method combining hit quality index based spectral matching and voting. Analytica Chimica Acta. 2013;758:58-65.
- Dégardin K, Guillemain A, Roggo Y. Comprehensive Study of a Handheld Raman Spectrometer for the Analysis of Counterfeits of Solid-Dosage Form Medicines. Journal of Spectroscopy. 2017;2017:1-13.
- United States Pharmacopoeial Convention, USP Technology Review: CBEx, (2017). http://www.usp.org/sites/default/files/usp/document/our-work/global-public-health/tr-report-cbex.pdf.
- Pomerantsev A, Rodionova O. Multiclass partial least squares discriminant analysis: Taking the right way-A critical tutorial. Journal of Chemometrics. 2018;32(8):e3076.
- Eliasson C, Matousek P. Noninvasive Authentication of Pharmaceutical Products through Packaging Using Spatially Offset Raman Spectroscopy. Analytical Chemistry. 2007;79(4):1696-1701.
- Lanzarotta A, Lorenz L, Batson J, Flurer C. Development and implementation of a pass/fail field-friendly method for detecting sildenafil in suspect pharmaceutical tablets using a handheld Raman spectrometer and silver colloids. Journal of Pharmaceutical and Biomedical Analysis. 2017;146:420-425.
- Tackman E, Trujillo M, Lockwood T, Merga G, Lieberman M, Camden J. Identification of substandard and falsified antimalarial pharmaceuticals chloroquine, doxycycline, and primaquine using surface-enhanced Raman scattering. Analytical Methods. 2018;10(38):4718-4722.
- Rebiere H, Ghyselinck C, Lempereur L, Brenier C. Investigation of the composition of anabolic tablets using near infrared spectroscopy and Raman chemical imaging. Drug Testing and Analysis. 2015;8(3-4):370-377.
- Rebiere H, Martin M, Ghyselinck C, Bonnet P, Brenier C. Raman chemical imaging for spectroscopic screening and direct quantification of falsified drugs. Journal of Pharmaceutical and Biomedical Analysis. 2018;148:316-323.
- Assi S. Authenticating medicines with dual laser handheld Raman spectroscopy. European Pharmaceutical Review. 2016;21:30-34
- Ellis D, Eccles R, Xu Y, Griffen J, Muhamadali H, Matousek P, Goodall I, Goodacre R. Through-container, extremely low concentration detection of multiple chemical markers of counterfeit alcohol using a handheld SORS device. Scientific Reports. 2017;7:1-8.
The rest of this content is restricted - login or subscribe free to access
 Thank you for visiting our website. To access this content in full you'll need to login. It's completely free to subscribe, and in less than a minute you can continue reading. If you've already subscribed, great - just login.
Why subscribe? Join our growing community of thousands of industry professionals and gain access to:
- bi-monthly issues in print and/or digital format
- case studies, whitepapers, webinars and industry-leading content
- breaking news and features
- our extensive online archive of thousands of articles and years of past issues
- ...And it's all free!
Click here to Subscribe today Login here
Issue
Related topics
Analytical techniques, Drug Counterfeiting, Handheld Raman, Raman Spectroscopy